¶ Recommended SQL Server Specifications
On the whole, each organization may have different requirements for their SQL server. However, as a base minimum, we recommend a SQL Server with at least
¶ CPU
3.4 GHZ CPU with at least 16 processing cores, 32 total threads
¶ RAM
32GB of ram
¶ Storage
- A very fast 200GB SSD for the OS
- One 200GB DATA SSD drive (with the fastest read/write/seek speeds as you can afford)
- The Data drives and Logs drives should be the fastest drives you have access to. Splitting data, logs, and backups onto separate drives can improve SQL performance. This is because when placed on separate drives, there is less competition for the same disk resources and thus, less contention for disk access. This can lead to faster and more efficient read and write operations.
- one 200GB Logs drive (with the fastest read/write/seek speeds as you can afford),
- one additional 500GB DRIVE for backups.
¶ Network
The server should also feature an extremely High-speed network connection, such as 10Gbps Ethernet or faster.
¶ Basic Optimizations
Venio databases operate in a "hybrid OLTP/OLAP" mode - while the workloads differ from pure OLTP, optimizing for analyst concurrency and fast queries is important. The lines blur between OLTP and OLAP at times.
¶ Fill Factor
For eDiscovery databases like Venio, a fill factor of 71% is generally recommended as a starting point.
The rationale is:
-
The data is largely static after initial ingestion, so less concern about fragmentation over time. No need to provision as much free space as a pure OLTP system.
-
Analyst query performance benefits from tighter page density versus 100% fill factor. More data packed per page means fewer reads.
-
Concurrency requirements mandate efficient memory and I/O usage. Lower fill factors help there.
-
There's still a steady stream of updates from analyst tagging and annotations. So some free space is helpful.
Based on this, 71-75% is a reasonable sweet spot to balance analyst query performance and fragmentation concerns.
However, it's still worth testing for your specific dataset and usage patterns. Factors like:
-
Average document size
-
Downstream I/O and memory capacity
-
Rate of analyst updates
-
Index fragmentation levels
May push you higher or lower. 71% gives you flexibility to tweak from there once you observe system performance with real data.
Here are our recommendations for setting fill factor and other optimizations for an eDiscovery project database like Venio:
¶ Set Fill Factor
Start with 71% fill factor for all indexes as a baseline:
ALTER INDEX ALL ON dbo.tbl_ex_fileinfo SET (FILLFACTOR = 71)

ALTER INDEX ALL ON dbo.tbl_ex_FileTagAssociation SET (FILLFACTOR = 71)

ALTER INDEX ALL ON dbo.tbl_ex_DuplicateFilePath SET (FILLFACTOR = 71)

ALTER INDEX ALL ON dbo.tbl_lg_DuplicateFilePathPopulationLog SET (FILLFACTOR = 71)

ALTER INDEX ALL ON dbo.tbl_ex_ExtractionInfo SET (FILLFACTOR = 71)

ALTER INDEX ALL ON dbo.tbl_ex_DuplicateCustodian SET (FILLFACTOR = 71)
- Monitor index fragmentation levels periodically. If consistently over 15-20%, lower fill factor. If very low fragmentation, increase incrementally to 72% and monitor how that change affects index fragmentation over time. If fragmentation is still very low, continue increasing incrementally but do not increase above 80%.
The key is continuously monitoring index fragmentation and system resource usage, and fine tuning the fill factors and indexes accordingly. Please let Venio support know if you need help implementing any of these recommendations!
¶ Prevent RDP
Disabling RDP entirely for all users can potentially help improve SQL Server performance and resource utilization. Some key reasons why:
-
RDP uses server resources even when idle. Each active RDP session consumes some memory, CPU cycles for encryption/graphics, and network bandwidth.
-
Users performing intensive GUI application work over RDP taps into resources SQL Server requires for best performance like CPU, memory, disk I/O. Heavy usage could contend with SQL Server workloads.
-
Accidental or intentional local resource intensive work over RDP can negatively impact SQL Server perf. Examples - heavy file operations, running multiple applications locally.
-
Malware or crypto mining over a compromised RDP session utilizes resources that hinders SQL Server workloads.
-
Potential locking out of higher priority SQL Server processes from resources without proper resource governance.
If server access is required for administration, monitoring and management - alternatives like PowerShell remoting, web based management consoles, remote SSMS (SQL Server Management Studio) connections, may have lower resource overheads. They also provide better resource governance and workload isolation capabilities through QoS policies.
Disabling RDP prevents every one of these high resource usage scenarios from accidentally or intentionally occurring, ensuring maximum resources remain available exclusively to SQL Server workloads. So for high performance SQL Server instances disabling RDP is definitely recommended.
¶ TempDB Configuration
For optimal TempDB performance with an eDiscovery workload, it is recommended to use multiple smaller TempDB data files rather than one large file.
The guidelines are:
- Use 8 TempDB data files if your server has at least 8 logical cores. Otherwise, use 1 file per logical core up to 8 files.
- Initially size each file equally at around 1GB - 2GB. Let the filesautogrow as needed, up to a maximum size limit.
- Stripe the TempDB files across multiple disks if possible, or provision the fastest storage possible for TempDB.
- Set instant file initialization for fast allocation when files autogrow.
The benefits of multiple smaller TempDB files are:
- Allows more parallel operations as each file can be accessed independently.
- Avoids contention when multiple sessions try to allocate space from one large file.
- If starved for space, smaller files can autogrow faster than one large file.
- Files can be placed on faster storage compared to one large file size-limited by available space.
So in summary, for high concurrency eDiscovery workloads, go with 8+ smaller TempDB files striped across fast storage rather than one big file to optimize TempDB throughput.
¶ Instant File Initialization
Instant file initialization
Data and log files are initialized to overwrite any existing data left on the disk from previously deleted files. Data and log files are first initialized by populating the files with zeros when you perform one of the following operations:
- Create a database
- Add log or data file to an existing database
- Increase the size of an existing file (including autogrow operations)
- Restore a database or filegroup
File initialization causes these operations to take longer. However, when data is written to the files for the first time, the operating system doesn't have to populate the files with zeros.
In the SQL Server, data files can be initialized instantaneously. This process creates fast execution of file operations listed above. Instant file initialization reclaims used disk space without populating that space with zeros. Instead, disk content is overwritten as new data is written to the files. Log files cannot be initialized instantaneously.
Note: This information was obtained from the following Microsoft article: https://learn.microsoft.com/en-us/sql/relational-databases/databases/database-instant-file-initialization
To enable instant file initialization:
- Click Run on the Start menu, and then enter secpol.msc.
- Expand Local Policies.
- Select the User Rights Assignment folder. The policies display in the details pane.
- Double-click Perform Volume Maintenance Tasks in the pane.
- Click Addin the Local Security Policy Setting dialog.
- Add your SQL Server service account (or a domain group) in the Select Users or Groups dialog.
- Restart the SQL service or server.
¶ Comparison of zero and instant initialization
The following article compares zero initialization and instant initialization (source: https://www.sqlskills.com/blogs/kimberly/instant-initialization-what-why-and-how/).
¶ Basic Maintenance
¶ SQL Backups
Please note, these are simply guidelines. Your organization's Information Technology or SQL DBA professionals may determine different backup policies and backup retention policies based on your organization's infrastructure, recovery policies, or needs.
Automated SQL Backups are the most essential maintenance and optimization task you can do. This is because automated SQL backups help prevent the log files from growing to uncontrolled sizes. The best way to automate backups in SQL Server is to use the built-in SQL Server Maintenance Plan Wizard. This wizard allows you to create a plan to back up databases on a regular schedule and store the backups in a secure location. It is also possible to configure the plan to delete old backups to ensure that the backup storage space is not exceeded.
We propose a backup strategy which encompasses transaction logs, differential backups, as well as full backups.
Transaction Log Backups
We recommend a transaction log backup strategy that will be executed every 15 minutes to ensure that all changes are captured, and that the transaction ldf container file does not grow to unsustainable sizes.
Let's hypothesize that a Venio project generates 10MB of transaction log activity every minute. After 15 minutes, you've generated 150MB of log activity - but that also means that since you need to have your Venio database in FULL recovery mode, your transaction log will need to be at least 150MB large. We propose a backup strategy for transaction logs that includes differential backups as well as full backups. This strategy will be executed every 15 minutes to ensure that all changes are captured.
If you back up that log file right away, and you don't have open transactions (or any of a host of other things that will cause SQL Server to keep the log file in use), you'll be able to clear out portions of it, keeping your log file small.
However, if you waited 6 hours to do a transaction log backup, that's approximately 3.5GB of logged activity - your transaction log file (LDF) would be 3.5GB.
Differential Backups
Differential SQL backups should be taken at least once every 8 hours to ensure that changes to the database are captured and stored.
Full backups:
The frequency of performing a full backup of a SQL database will vary depending on the size and complexity of the Venio project case, as well as how frequently the Venio project is utilized. Generally speaking, a full SQL database backup should be performed at least once per week.
To summarize, SQL Server Maintenance Plan Wizard allows you to create a plan to back up databases on a regular schedule and store the backups in a secure location. This plan should include transaction log backups every 15 minutes, differential backups every 8 hours, and full backups of the database at least once per week. Configuring the plan to delete old backups will ensure that backup storage space is not exceeded.
Deleting old backups
The best way to automate backups in SQL Server is to use the built-in SQL Server Maintenance Plan Wizard. This wizard allows you to create a plan to back up databases on a regular schedule and store the backups in a secure location. It is also possible to configure the plan to delete old backups to ensure that the backup storage space is not exceeded.
Transaction Log Backup, we recommend a retention period of 24 hours if you are making 15 minute backups. Any transaction logs older than 24 hours can be safely deleted.
Differential Backup we recommend a retention period of 72 hours if you are making 8 hour backups. Any Differential logs older than 72 hours can be safely deleted.
Full Backup, we recommend a retention period of 2 weeks if you are making weekly backups. Any Full backups older than 2 weeks can be safely deleted. Keep in mind, there are always trade offs. The longer you can store backups, the further back you can recover the database, but the more storage you will need for backups.
Another way to automatically delete old backup files is to use a scheduled task or job in SQL Server. This can be done using the SQL Server Agent, which is a feature that comes with most versions of SQL Server. This will allow you to schedule a task to run at regular intervals, such as daily or weekly, to delete any files that are older than a certain amount of time. You can also set a threshold for the size of the backup files that should be deleted, such as only deleting files that are larger than a certain size. Additionally, you can use the Windows Task Scheduler to manage the task and set it to run at regular intervals.
Regular Maintenance: Perform routine database maintenance tasks like index rebuild/reorganization, statistics updates, and database backups. Regularly monitor performance metrics and identify areas that need improvement.
¶ Updating Statistics and Defragmentation
- Updating statistics: Updating statistics ensures that the query optimizer has accurate information about data distribution when generating execution plans. It impacts the query optimizer's decisions, such as index selection, join order, and cardinality estimation.
- Index defragmentation: Index defragmentation focuses on reducing fragmentation within indexes. Fragmentation occurs when data pages within an index become disorganized, leading to suboptimal query performance. Defragmenting indexes rearranges the data pages to improve data locality, reduce disk I/O, and enhance query performance. This process involves rebuilding or reorganizing indexes using the
ALTER INDEXstatement or dedicated index maintenance tasks.
While both updating statistics and index defragmentation are important for maintaining optimal SQL Server performance, they address different aspects of performance optimization:
- Index defragmentation focuses on physical data organization within indexes, reducing fragmentation and improving data access efficiency.
- The primary purpose of tables statistics is that they contain information about the distribution of data within columns, helping the query optimizer generate efficient execution plans. The update statistics process ensures that the statistics accurately reflect the current data distribution, leading to better query plans and improved performance.
sp_updatestatsdoes not directly defragment indexes.
In summary, sp_updatestats updates statistics to provide accurate information for query optimization, while index defragmentation focuses on physical data organization to improve data access efficiency. Both processes are valuable for maintaining optimal performance, but they address different aspects of SQL Server optimization.
¶ Update Statistics, Then Defragment Indexes
SP_Updatestats is a stored procedure that updates the statistics of all the tables and indexes in the current database. It is necessary to do this regularly to keep the query optimizer using up-to-date information for optimization decisions. Updating the statistics ensures that the query optimizer can make better decisions that result in better query performance.
Step 1) Run SP_Updatestats in the project database
USE prj_Socrates_13; --change to project database name
exec sp_updatestats;
Step 2) Check to see if defragmentation is necessary: This script will not do anything except return results to see if it may be necessary to defragment indexes. Execute the following Select statement which will return results of the index name, tablename, fragmentation percentage, and page size.
USE prj_Socrates_13; --change to project database name

SELECT S.name as 'Schema',
T.name as 'Table',
I.name as 'Index',
DDIPS.avg_fragmentation_in_percent,
DDIPS.page_count
FROM sys.dm_db_index_physical_stats (DB_ID(), NULL, NULL, NULL, NULL) AS DDIPS
INNER JOIN sys.tables T on T.object_id = DDIPS.object_id
INNER JOIN sys.schemas S on T.schema_id = S.schema_id
INNER JOIN sys.indexes I ON I.object_id = DDIPS.object_id
AND DDIPS.index_id = I.index_id
WHERE DDIPS.database_id = DB_ID()
and I.name is not null
AND DDIPS.avg_fragmentation_in_percent > 0
ORDER BY DDIPS.avg_fragmentation_in_percent desc`
Step 3) Actually running defragmentation: For small tables with smaller page size, it is not uncommon to see fragmentation above 50%, but if you receive a lot of results where the fragmentation on large tables is greater than 50%, Change the following query to the project database you checked in Step (2) and execute the query. This may take some time depending on the size of the database, and how many indexes are highly fragmented. This query may lock the database, so make sure no jobs are running and no one is accessing the project in Venio.
USE prj_Socrates_13 -- change to project database name

DECLARE @schemaName VARCHAR(50);
GO
DECLARE @Queryresult NVARCHAR(max)
SET @Queryresult=''
SELECT
@Queryresult=@Queryresult + 'ALTER INDEX ' + QUOTENAME(i.name) + ' ON '
+ QUOTENAME(OBJECT_NAME(i.OBJECT_ID)) + ' REBUILD;'
FROM sys.dm_db_index_physical_stats(DB_ID(), NULL, NULL, NULL, 'SAMPLED') ss
INNER JOIN sys.indexes i ON i.OBJECT_ID = ss.OBJECT_ID AND i.index_id = ss.index_id
INNER JOIN sys.objects o ON ss.object_id = o.object_id
WHERE ss.avg_fragmentation_in_percent > 10
AND ss.record_count > 0
AND o.is_ms_shipped = 0 --Excludes any objects created as a part of SQL Server installation
AND ss.index_id > 0 --Excludes heap indexes
EXEC sp_executesql @Queryresult
ALTER INDEX is a SQL statement used to modify existing indexes in a database. The above query uses it to rebuild an index, which can improve performance if the index has become fragmented or contains obsolete statistics. This query in step 3) selects and alters the index on all indexes whose average fragmentation is greater than 10, record count is greater than 0, and is not shipped by Microsoft.
If you would like to run defragmentation on every database in your SQL server, you could use the following script.
DECLARE @db_name VARCHAR(128)
DECLARE cur_dbs CURSOR FOR
SELECT name
FROM sys.databases
WHERE name NOT IN ('master', 'tempdb', 'model', 'msdb')

OPEN cur_dbs

FETCH NEXT FROM cur_dbs INTO @db_name

WHILE @@FETCH_STATUS = 0
BEGIN
DECLARE @SQL nvarchar(MAX) =
'USE '+ @db_name + ' EXEC sp_updatestats;
DECLARE @schemaName VARCHAR(50);
DECLARE @Queryresult NVARCHAR(max)
SET @Queryresult=''''
SELECT
@Queryresult=@Queryresult + ''ALTER INDEX '' + QUOTENAME(i.name) + '' ON ''
+ QUOTENAME(OBJECT_NAME(i.OBJECT_ID)) + '' REBUILD;''
FROM sys.dm_db_index_physical_stats(DB_ID(), NULL, NULL, NULL, ''SAMPLED'') ss
INNER JOIN sys.indexes i ON i.OBJECT_ID = ss.OBJECT_ID AND i.index_id = ss.index_id
INNER JOIN sys.objects o ON ss.object_id = o.object_id
WHERE ss.avg_fragmentation_in_percent > 10
AND ss.record_count > 0
AND o.is_ms_shipped = 0
AND ss.index_id > 0
EXEC sp_executesql @Queryresult'
select @SQL
EXEC sp_executesql @SQL
FETCH NEXT FROM cur_dbs INTO @db_name
END

CLOSE cur_dbs
DEALLOCATE cur_dbs
Step 4) Re-run the select statement query we ran in step 2 to make sure fragmentation has decreased. For tables with less than 10 pages, they will still be above 30%, but the others should now be much lower.
Step 5) If the SQL server drive used for backups is full, SQL Server will not be able to write to the drive and will not be able to perform backups. This can lead to a decrease in performance, as the SQL Server will be spending more time attempting to write data to the drive than it is performing other tasks. Also, consider using separate drives for backups than used for data files and/or log files. If backups run on the same drive as MDF database data files and LDF log files this can also cause SQL performance to be impacted because you now have all the writes and reads from the SQL server processing sharing bandwidth with the writes for the backups and logs. Please also refer to our guide on SQL database backups: https://support.veniosystems.com/hc/en-us/articles/11971899104275-SQL-Database-Backup-Policy-Recommendations
Step 6) After you have completed the previous steps, Close and reopen Venio console or Venio VOD. Now open the project and test to ensure the work above has improved the performance of the project.
¶ Advanced Optimization
These are advanced options and should be changed only by an experienced database administrator or certified SQL Server professional.
¶ Max degree of parallelism (MAXDOP)
For the best optimization of your SQL database, please refer your SQL DBA to the following Microsoft article regarding modification of the max degree of parallelism in your SQL server environment. https://learn.microsoft.com/en-US/sql/database-engine/configure-windows/configure-the-max-degree-of-parallelism-server-configuration-option?view=sql-server-ver15
¶ Cost Threshold for Parallelism (CTFP)
Another related setting in SQL Server that deals with parallelism is 'cost threshold for parallelism' (CTFP). This setting controls the threshold at which SQL Server creates and runs parallel plans for queries.
By default, the CTFP is set to 5, which is a relatively low value that was originally chosen many years ago when servers typically had only one or two processors. Today, with servers having many more cores, many database administrators recommend increasing the CTFP value to better balance the load of parallel and non-parallel queries.
The ideal setting for CTFP can vary greatly depending on your workload, hardware, and other factors. It's often recommended to start with a value of 25 then adjust it from there based on monitoring your server's performance and the characteristics of your workload. We do not recommend setting the value higher than 50, as that generally cuases the threshold to be too high for queries which could otherwise benefit from parallelization.
Like MAXDOP, the CTFP is not a "set it and forget it" setting, and adjusting it should be part of a process of iterative performance tuning.
Again, it's important to carefully monitor your server's performance after making these adjustments, and you might want to involve a database administrator or a performance tuning specialist in this process if possible.
¶ Worker Threads
Just as important as managing data and indexes is the management of the server's worker threads. These threads are what SQL Server uses to manage and execute tasks, including your queries. Too few worker threads, and your server might not have enough resources to execute all tasks in a timely manner. Too many, and you risk overloading the server with context switching, causing overall performance to decrease.
By default, SQL Server dynamically adjusts the number of worker threads that are spawned based on the processor's architecture, number of CPUs, and the number of cores within a CPU. While this configuration works well for most installations, it may not always be optimal for specific workloads.
You can manually configure the maximum number of worker threads that SQL Server can use via the "max worker threads" server configuration option. This is an advanced configuration and should be changed only by an experienced database administrator. However, it is generally recommended to leave this setting at its default (0), allowing SQL Server to manage worker threads dynamically.
Monitor the "SQLServer:General Statistics\User Connections" counter in the Performance Monitor tool to determine if you're frequently running out of worker threads. If this counter is close to your configured "max worker threads" value, consider increasing the maximum number. Be aware that this should be done cautiously, as increasing the number of worker threads will also increase the server's overhead for managing these threads.
If you encounter a scenario where you do need to increase the maximum number of worker threads, consider also reviewing your application for opportunities to reduce connection pooling or lower the demand for concurrent connections.
For the best optimization of your SQL server's worker threads, please refer your SQL DBA to the following Microsoft article regarding the modification of the 'max worker threads' in your SQL Server environment. https://docs.microsoft.com/en-us/sql/database-engine/configure-windows/configure-the-max-worker-threads-server-configuration-option.
In addition to these, remember that optimizing SQL Server performance is an ongoing process that involves continuous monitoring and tweaking based on changing workloads. Be sure to regularly review your SQL Server's health and performance, adjusting configurations as necessary for optimal results.
¶ Additional Considerations:
¶ Hardware Considerations
Ensure that your database server has sufficient resources (CPU, memory, storage) to handle the workload. Consider factors like disk speed, RAID configurations, and memory allocation to optimize performance. Regularly monitor and tune hardware configurations as needed.
¶ Monitoring and Tuning
Implement monitoring solutions to track database performance and identify bottlenecks. Use tools like SQL Server Profiler, Performance Monitor, and Execution Plans to analyze query performance, identify slow queries, and fine-tune them for better performance.
- Remember that performance tuning is an iterative process, and it's important to test and measure the impact of changes to ensure they yield the desired improvements. It's also recommended to consult database experts, utilize performance monitoring tools, and consider specific best practices and guidelines provided by your database vendor.
¶ Regular Updates and Patches
Keep your database software up to date by applying the latest updates and patches. These updates often include performance optimizations and bug fixes that can enhance overall database performance.
¶ Data Partitioning
While the Venio application does not support data partitioning directly, you may still be able to implement a form of data partitioning at the database level using some workarounds. Here are a few alternative approaches you can consider:
Archiving and Purging: Instead of directly partitioning the data, you can consider implementing archiving and purging strategies. Archive older or less frequently accessed project databases to separate storage, such as historical databases or file systems, while keeping the active and recent databases in the main SQL server instance. This approach helps manage the data size and optimize query performance.
It's important to note that these alternative approaches require careful planning, database design considerations, and potentially custom development work. You'll need to evaluate the specific requirements and limitations of Venio, consult database experts, and assess the impact on your overall architecture and data management strategy.
Additionally, always thoroughly test and measure the performance impact of any partitioning-like approach to ensure it meets your performance and scalability goals while maintaining data integrity and consistency.
¶ Securing Windows SQL Server connections
Related Article: https://support.veniosystems.com/hc/en-us/articles/16779304209043
Securing Windows SQL Server connections is an important part of protecting an organization’s data. It is important to ensure that only authorized users are able to access sensitive information and that data is being transmitted securely.
There are several steps that should be taken to secure Windows SQL Server connections.
1.) Ensure that the Windows server is properly patched and updated with the latest security updates. This will prevent attackers from exploiting any known vulnerabilities in the system.
2.) Ensure that the Windows server is properly configured to use two-factor authentication for user logins. This will add an additional layer of security to the system and help to prevent unauthorized access.
3.) Ensure that the Windows server is configured with strict access control lists. This will help to ensure that only authorized users are able to access the system and any sensitive data stored on it.
4.) Ensure that the Windows server is properly monitored for suspicious activity. This will help to detect any unauthorized access attempts or malicious activity.
5.) Enable encryption for Windows SQL Server connections. This can be done by enabling the encryption option in the Windows SQL Server Configuration Manager. Once the encryption is enabled, the client must also be configured to support secure connections. This is usually done by installing a certificate on the client machine. Once the configuration is complete, all traffic between the server and the client will be encrypted. This means that data sent over the network will be secure and can’t be accessed by anyone else.
¶ Server & Certificate Prerequisites
- The SSL certificate must be issued for server authentication. The certificate name (CN) must be the fully qualified domain name (FQDN) of the machine. You can verify this as Enhanced Key Usage property of the certificate, which must specify Server Authentication (1.3.6.1.5.5.7.3.1).
- The server must have an installed (imported) certificate and SQL client machines must be set up so as to trust the root authority of the certificate.
- You must be running SQL Server Configuration Manager under the same user account as the SQL Server Service unless the service is running as a Local System, Network Service or Local Service.
- The certificate must be stored either in a local computer certificate store or the current user certificate store.
- The system time must be such, which is after the “Valid from” property of the certificate and before the “Valid to” property of the certificate.
- The client must be able to verify the ownership of the certificate used by the server.
We will go through the following points to enable encrypted connection with SQL Server :
- Provide with (install) a certificate on the server
- Export the server certificate
- Configure server to accept encrypted connections
- Encrypt a connection from SQL Server Management Studio
¶ Provide with (install) a certificate on the server
Providing with a certificate is the process of installing a certificate by importing it into your machine.
-
On the Start menu, click Run. In the opened dialog box, type MMC and click OK.

Run Menu
In the MMC console, on the File menu, click Add/Remove Snap-in.
-
In the Add/Remove Snap-in dialog box, click Add.
-
In the Available Snap-in dialog box, click Certificates, and then click Add.

Add Remove Snap In
-
In the Certificates snap-in dialog box, click Computer account, and then click Finish.
-
Now, in the Add/Remove Snap-in dialog box, click OK.
-
Go to Certificates snap-in, expand Certificates, expand Personal folder, and then right-click Certificates, point to All Tasks, and then click Import.

Import Certificate -
At Certificate Import Wizard, browse the certificate path and add to the computer, close the MMC console.
¶ Export the server certificate
-
Go to Certificates snap-in, locate your certificate in the Certificates/Personal folder, right-click the Certificate, point to All Tasks, and then click Export.

Export Certificate -
Complete the Certificate Export Wizard, storing your certificate file at your convenient path.
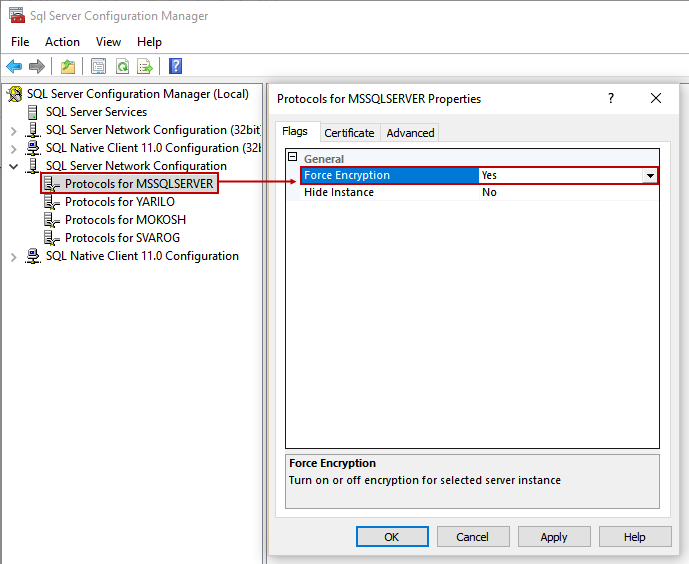
¶ Configure SQL server to accept encrypted connections
- Open SQL Server Configuration Manager, expand SQL Server Network Configuration, right-click Protocols for , and then select Properties.
SQL Server Configuration Manager

- At Properties dialog box, on the Certificate tab, select the desired certificate from the drop down menu for the Certificate box, and then click OK.
- On the Flags tab, in the Force Encryption box, select Yes, and then click OK to close the dialog box.

- Restart the SQL Server service.
¶ Encrypt a connection from SQL Server Management Studio
-
¶ Configure SQL Server to use encrypted connection
Open SQL Server Configuration Manager, expand SQL Server Network configuration, choose Protocols properties for a desired SQL Server instance (in this case, it is a default instance). Enable ForceEncryption option in Flags tab,
and choose the certificate from drop-down menu:
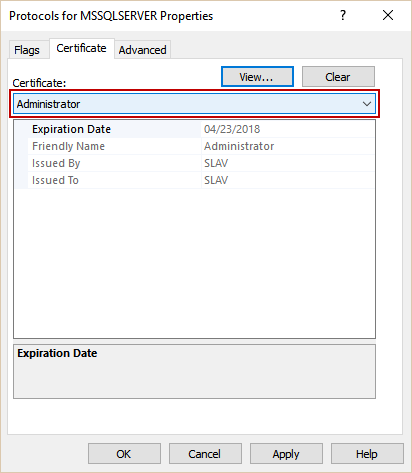
Confirm the settings and restart the SQL Server service to apply changes.
¶ Checking Whether Connections are Encrypted
Although sp_who2 doesn’t include information about whether each connection is encrypted, there is a DMV that does this. The DMV is sys.dm_exec_connections, this has a row for each connection to the instance, and the column encrypt_option is a boolean value which describes whether the connection is encrypted. The following query will list all connections and whether they are encrypted :
-- list connections and encryption status
SELECT session_id,encrypt_option
FROM sys.dm_exec_connections
This query can then be extended to list the number of encrypted and the number of unencrypted connections :
-- Summarize number of connections of each type
SELECT
SUM(CASE WHEN encrypt_