¶ Performance Testing
Performance testing is a good way to identify potential bottlenecks in your venio environment.
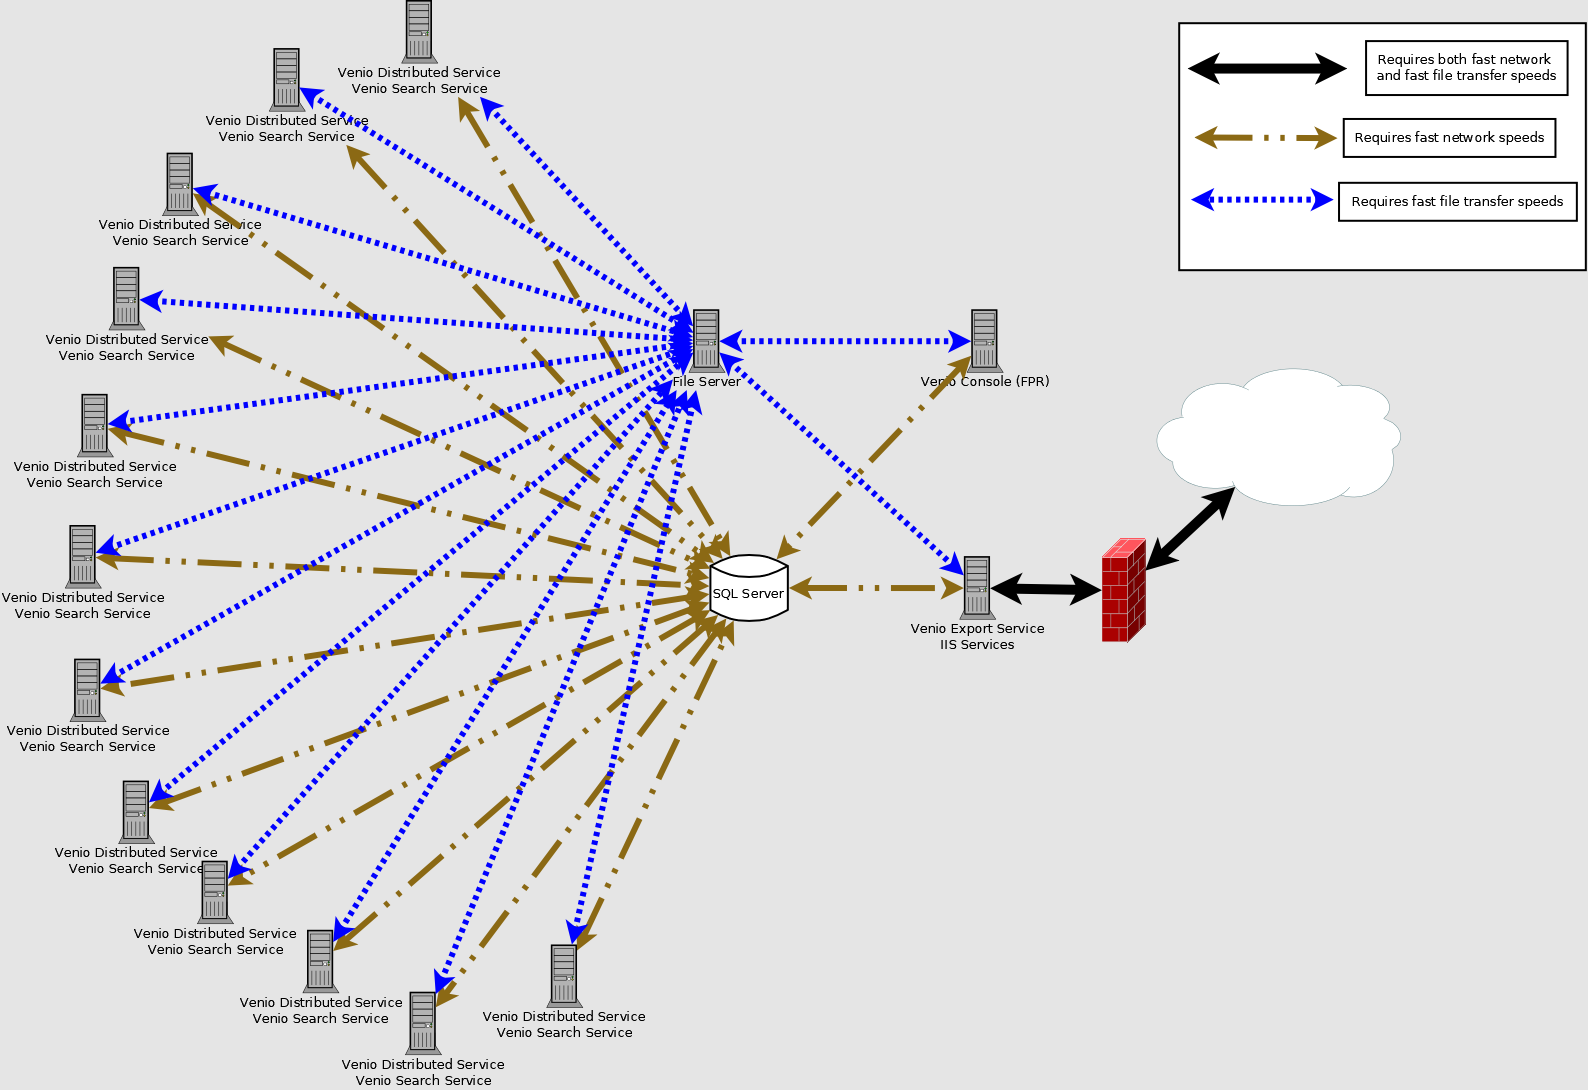
¶ Each line on the diagram represents an individual test:
- Solid black lines indicate you should test both file transfer and network speeds for potential optimizations. Use a utility like CrystalDiskMark to test file transfer speeds across a range of parameters - seek times, read/write times, small and large file copies. To test network performance between the servers, I would recommend your infrastructure team to test using a tool like iperf or ntttcp.
- Dotted blue lines mean focusing on file transfer speeds is most important. Use CrystalDiskMark as mentioned above.
- Dashed brown lines indicate network speed tests are the priority for optimizations. As suggested earlier, using a tool like iperf or ntttcp is recommended for testing network performance.
¶ Synopsis:
Following is a list of basic information Venio support may ask for in order to asses the capabilities of your on-prem venio installation.
1. Network File Transfer Speed: You can use PowerShell commands to measure file transfer speed between systems. Or, you can use open-source tools like iPerf3 for network performance measurement.
2. Server Resources (CPUs, RAM, Storage): You can use PowerShell commands to collect system resource information, such as the number of processors, RAM, and storage size. Or, open-source tools like Glances, Nagios, Zabbix, and Prometheus are available for more detailed monitoring.
3. Disk Speed: Disk speed can be tested by writing and reading a large file using PowerShell commands. Alternatively, open-source tools like CrystalDiskMark can be used.
4. SQL Server Configuration: SQL Server configurations can be checked using SQL Server Management Studio commands.
5. SQL Server Backup Policies: Backup policies can be investigated by querying the msdb database within the SQL Server Management Studio.
In addition, it's important to consider factors like latency, database locks, disk I/O, resource utilization, application logs, failover and recovery mechanisms, and security. Cooperation from your IT team will be necessary to gather this comprehensive information.
¶ Detailed Explanation:
We have a number of items that are necessary to obtain a comprehensive overview of an organization's current or planned Venio On-Prem environment's performance. This is quite a comprehensive list of items to check, and getting all of them might require multiple commands and scripts. We also have alternative third-party opensource software that may be utilized instead of the scripts, depending on your organization's security policies. For the purpose of clarity, I'll break down the items to check, and provide commands or instructions for each.
Please keep in mind that the more distributed your environment, the more server combinations these tools will need to be tested against. For example, from each distributed service host to each SQL server, from each distributed service host to each console, from each distributed service host to each file server, from each file server to each Venio Web Export Service host, etc...
1. Network File Transfer Speed
Without 3rd party open-source utilities, You can measure network file transfer speed by copying a test file between the systems. Using PowerShell, you can time how long it takes to copy a file to the network share:
destination = "\\network\share\path"
sw.Start()
Copy-Item $source -Destination sw.Stop()
$sw.Elapsed.TotalSeconds
Replace the `source\` and \`destination` paths to reflect your own environment. The script will output the time in seconds that the file took to copy.
If your organization allows it, you can also obtain this (and more) information using iPerf/iPerf3. This is a commonly used network testing tool that can create TCP and UDP data streams and measure the throughput of a network that is carrying them. iPerf is a modern alternative for measuring maximum TCP and UDP bandwidth performance. It can report bandwidth, latency, and packet loss. iPerf3 is a new implementation from scratch, with the goal of a smaller, simpler code base, and a library version of the functionality that can be used in other programs.
2. Server Resources (CPUs, RAM, Storage)
You can use PowerShell to collect this information:
# CPUs
(Get-WmiObject -Class Win32_ComputerSystem).NumberOfProcessors
# RAM (in GB)
"{0:N2}" -f ((Get-WmiObject -Class Win32_ComputerSystem).TotalPhysicalMemory /1GB)
# Storage (this will list all drives and their size in GB)
Get-WmiObject -Class Win32_LogicalDisk | Select-Object DeviceID, @{Name="Size(GB)";Expression={"{0:N2}" -f ($_.Size/1GB)}}
If your organization allows the use of third party tools, here are several open-source tools that can collect system resource information:
-
Glances: This is a cross-platform monitoring tool written in Python. It uses the PsUtil library to get information from your system. It can monitor CPU, Load Average, Memory, Network Interfaces, Disk I/O, Processes and File System spaces utilization. Glances can work in client/server mode and is capable of remote monitoring. It also has a rich API that can be used by another software.
-
Nagios: Nagios is a powerful monitoring system that enables organizations to identify and resolve IT infrastructure problems before they affect critical business processes. Nagios can monitor system metrics, network protocols, applications, services, servers, and network infrastructure.
-
Zabbix: Zabbix is an enterprise-class open-source distributed monitoring solution designed to monitor and track performance and availability of network servers, devices, and other IT resources. It supports distributed and WEB monitoring, auto-discovery, and more.
-
Prometheus: Prometheus is an open-source system monitoring and alerting toolkit. It can collect metrics from configured targets at given intervals, evaluate rule expressions, display the results, and can trigger alerts if some condition is observed to be true.
Note: These tools require installation and setup, and they provide much more features than just monitoring system resources, but they are very powerful and flexible. Your IT organization may have these tools already available. If so, they can provide us the information from whatever server monitoring tools in use.
3. Disk Speed
We recommend the use of crystaldiskmark to pull these statistics and assess the disk IO speed from all of your distributed service hosts to the file server, as well as from all of your distributed service hosts to your SQL server(s). Please refer to the article: https://support.veniosystems.com/hc/en-us/articles/16125676282387-Testing-Disk-Performance
Disk speed is a bit more complicated to check without third-party tools. You can try writing a large test file to the disk and measure how long it takes with PowerShell. This will give you a rough idea of disk write speed. Disk read speed can be similarly tested.
Disk speed information on all servers should be collected in order to properly diagnose bottlenecks. For example, running the tests from each distributed service host can help identify if there are network issues negatively impacting 1 or more of the distributed servers from accessing the shared repository folder properly. You should also run this utility on each of the distributed service host's local drives to ensure the distributed service temp storage is sufficiently fast. If you are encountering issues in your OnDemand environment, this information should also be used to asses the speed from the server hosting the Venio Web Export Service to the server hosting the case file repository.
Here's an example of a simple PowerShell script that can be used to roughly measure the write and read speed of a disk:
# Write Speed Test
length = 500MB
stopwatch = [Diagnostics.Stopwatch]::StartNew()
stream = \[IO.File\]::OpenWrite(filePath)
$buffer = new-object byte[] i=0; $i -lt blockSize; i++){
stream.Write($buffer, 0, buffer.Length)
}
stream.Close()
writeSpeed = "{0:N2}" -f (($length / 1MB) / $stopwatch.Elapsed.TotalSeconds)
"Write Speed: $writeSpeed MB/sec"
# Read Speed Test
stopwatch.Start()
stream = \[IO.File\]::OpenRead(filePath)
for($i=0; $i -lt blockSize; i++){
stream.Read($buffer, 0, buffer.Length)
}
stream.Close()
readSpeed = "{0:N2}" -f (($length / 1MB) / $stopwatch.Elapsed.TotalSeconds)
"Read Speed: $readSpeed MB/sec"
# Cleanup
Remove-Item $filePath
This script creates a test file in the C:\temp\ directory (you might need to modify this path according to your system), writes data to it and then reads the data back, timing both operations. The write speed and read speed are then calculated and displayed in MB/sec. The test file is removed at the end.
This test gives a very rough idea of the disk's speed. The actual performance you can get might be affected by various factors like system load, file system, disk caching, and others. Therefore, if you need accurate and detailed disk performance information, it's recommended to use a specialized disk benchmarking tool.
Before running this script, ensure you have enough free disk space for the test file. The script uses a test file size of 500MB. You can adjust the $length variable to use a different test file size if needed.
4. SQL Server Configuration
The SQL Server configuration can be queried directly from within SQL Server Management Studio. The `max degree of parallelism` (MAXDOP) configuration option, for example, can be queried with:
SELECT value FROM sys.configurations WHERE name = 'max degree of parallelism'
5. SQL Server Backup Policies
Backup policies are often implemented via SQL Server Agent jobs or Maintenance Plans. You can query the `msdb` database to get information on the last run time and status of all jobs:
SELECT * FROM msdb.dbo.sysjobs
Additionally, information about the backup history can be queried from the `msdb` database:
SELECT * FROM msdb.dbo.backupset
¶ Here are some other aspects that should be monitored in any client-server application environment (like Venio) which relies on a SQL database:
1. Latency: The time it takes for a packet of data to get from the client to the server could have a significant impact on performance. High latency could lead to a slow and unresponsive application. You can test network latency by using the PowerShell cmdlet `Test-Connection`.
2. Database locks and deadlocks: Monitor the database for any locking or blocking issues. Long-running transactions or transactions that cause blocking can significantly affect application performance. SQL Server provides built-in ways to monitor and diagnose locking and blocking problems.
3. Resource utilization: Monitor the CPU, memory, disk, and network usage on both the client and server systems. Excessive usage of these resources could indicate a problem. PowerShell provides cmdlets like `Get-Counter` to monitor resource utilization.
4. Application logs: Review the application logs regularly for any errors or warnings. They can provide valuable insights into the performance of your application.
¶ Wrap-up
Remember that the above are general suggestions and might need to be adapted to your specific environment and needs. Each test and aspect might require different tools and methodologies to assess correctly.
Again, please remember that this is a substantial amount of information to gather and will require significant cooperation from your organization's IT team.
Please contact Venio Support if you have any questions after reviewing the diagram. Also, please note that aside from the connections between each server, the attached storage for each server is also important, particularly the speeds of the attached drives on the SQL server, the speed of the disks within your file server, as well as the drive speeds of the disks where the venio temp folder resides on the distributed services. (C:\Venio or D:\Venio or some other drive depending on your configuration)
¶ Recommended Disk IO speeds
For optimal performance, try to acheive at least 100+ MiB/s (880 mb/s) random 4K read and 50+ MiB/s (416 mb/s) random 4K write for an eDiscovery environment.
If you are below these speeds, and noticing slowness in performance, consider switching the NAS and SQL server storage to faster SSDs/NVMe to improve the random 4K speeds. This would provide the best performance.
Consider scaling out with more NAS/SQL servers if need be to increase aggregate throughput.